Send-Time Optimization
Use send-time optimization (STO) to choose the best time to send a communication to end users. Doing so could increase the click and open rates.
This feature works based on the history of an end user's interactions with messages. The flow tracks and analyzes the history of these interactions. Example: End users open the message or click a URL in the message. Based on these metrics, the flow determines the optimal time to send the message, that is, the time the end user is most likely to open it.
You can track the history in the Contact Information section of a person profile in People.
You can use STO only after you have sent your first 5 campaigns.
To use STO, you must enable URL tracking.
Each channel has different options that can be used with STO.
| Channel | STO Options |
|---|---|
| SMS | Click Rate |
| Open Rate Click Rate | |
| Voice | Phone Pickup Rate |
| Push | Open Rate |
| Open Rate Click Rate | |
| Viber | Open Rate |
| Telegram | Open Rate |
Send-time optimization in flows
Send-time optimization enables the flow to choose the best time within the next 24 hours to send the message to the end user.
Enable this option in Send elements (Elements such as SMS, Email, and Viber, which send messages) in your flow.
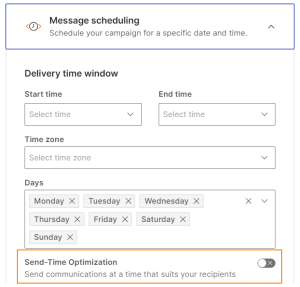
If it is important for you to send a message only within a specific period, enable STO and configure the delivery time window. The flow tries to find the best time to send the message. If the flow does not find an optimal time until the beginning of the delivery time window, the message will go out at that time.
Enable send-time optimization
Select the channel element to open the side panel. Do the following when creating the message.
- In the Tracking and reporting > Tracking options section, select Track URL clicks so that this data can be used to optimize the send time.
- In the Message scheduling section, select Send-time optimization.

Send-time optimization in Broadcast
Send-time optimization enables the broadcast to choose the best time within the next 24 hours to send the message to the end user.
STO is available for all channels in Broadcast.
If you enable STO and configure the delivery time window, the maximum time before sending a message is also considered for send-time optimization.
Because STO depends on data collected from a person's activity to optimize the send time, STO will not work with files in Broadcast. This is because files do not contain a history of activity that is needed for STO to work.
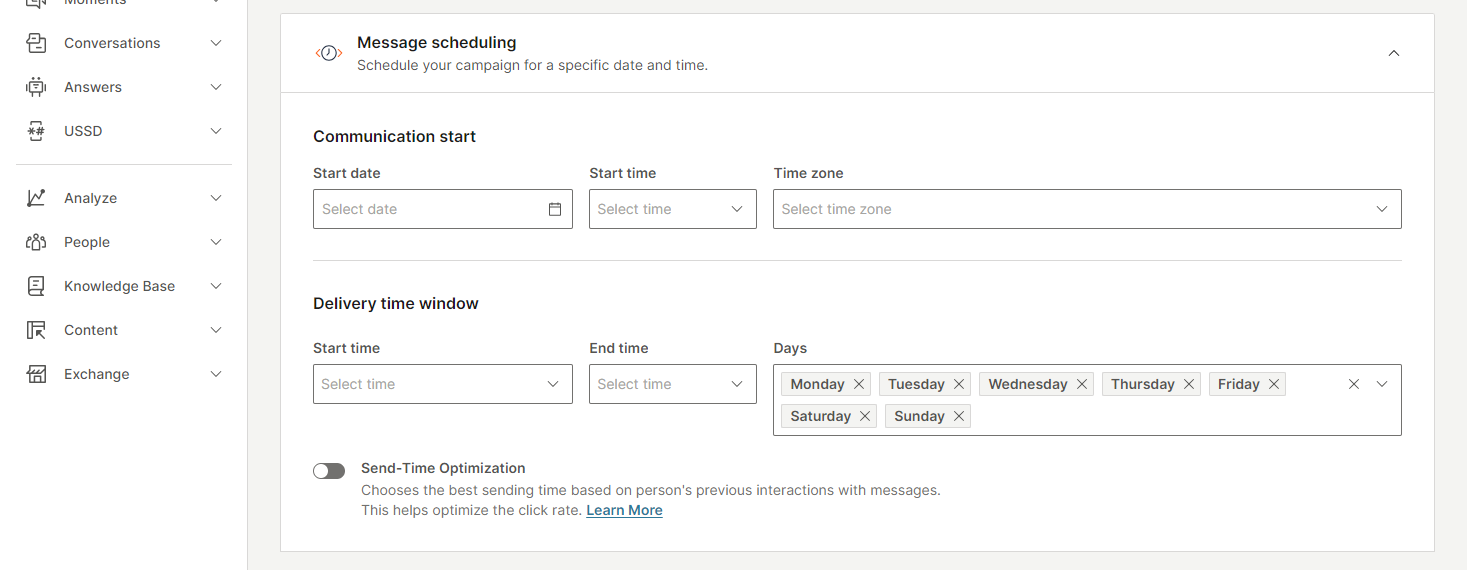
If it is important for you to send a message only within a specific period, enable STO and configure the delivery time window. The broadcast tries to find the best time to send the message. If the broadcast does not find an optimal time until the beginning of the delivery time window, the message will go out at that time.
Enable send-time optimization
- In the Tracking and reporting > Tracking options section, select Track URL clicks so that this data can be used to optimize the send time.
- In the Message scheduling section, select Send-time optimization.

Campaign analytics with send-time optimization
After you launch your flow or broadcast, the metrics are available as soon as Infobip starts receiving the data about the sent messages.

Analytics for any communication with STO consist of the following sets of data:
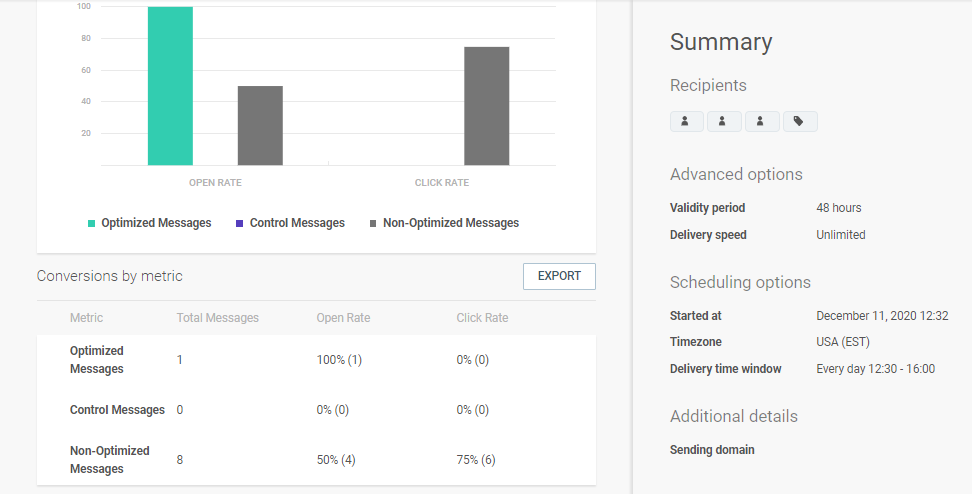
- Optimized Messages - sent using STO. Both Broadcast and Moments automatically include end users for whom there is enough information for using STO. The communication is split into 2 groups: optimized messages (90%) and control messages (10%).
- Control Messages - sent without STO at the scheduled time. The control group is automatically included at the campaign launch or within the scheduled delivery time window. The control group helps identify whether STO worked better than regular scheduling.
- Non-Optimized Messages - regular scheduling. The remaining recipients, for whom there is not enough data to use STO, are marked as Non-optimized messages. Messages to these recipients are sent based on regular scheduling.
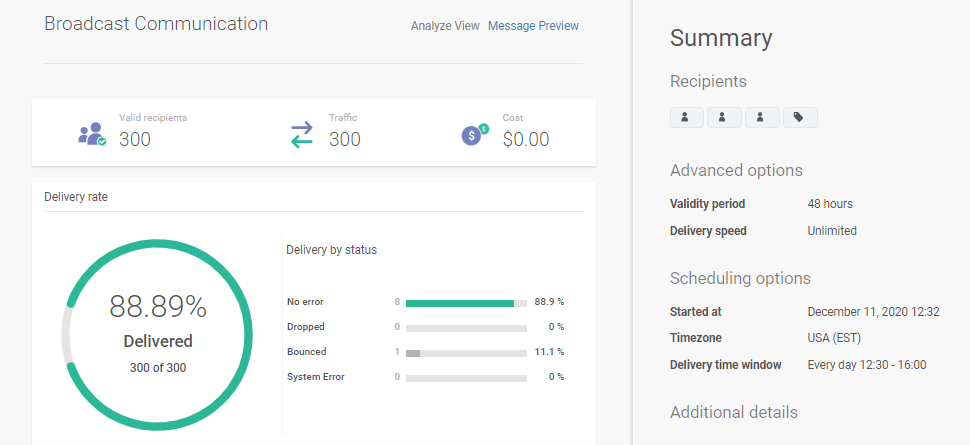
The following image shows what the results page in Broadcast looks like. The image does not show actual data.
