Mobile Churn Prediction
Monthly active users (MAU) for an app are a core metric for most mobile oriented businesses across all industry including media, entertainment, social media, and other subscription services. That is why retention of mobile audience is one of the core challenges for businesses who rely on mobile apps.
It is very important to find the right segment of users that are going to churn and communicating with them at the right time. Use Mobile churn prediction as a way of predicting the probability of certain events occurring in the future to see if a user will churn.
Mobile churn is defined as a lack of user mobile app activity. This is calculated by using an AI-powered model that looks at the past data of all end users who have already churned. The model then calculates the likelihood that a particular end user will also stop using the mobile app in the future based on their activity in the app.
The model will output a churn prediction score which is added to a person profile. The score can then be used to allow business to build efficient engagement strategies for their users and increase retention.
What event data do we analyze?
The following event data and all custom events are analyzed:
- Install App
- Launch App
- Personalized
- Depersonalized
- Uninstall
Infobip does not analyze any personal data when creating mobile churn predictions.
Prediction Score
The churn prediction score applied to profiles is split into three prediction quality groups: High, Medium, and Low churn prediction.
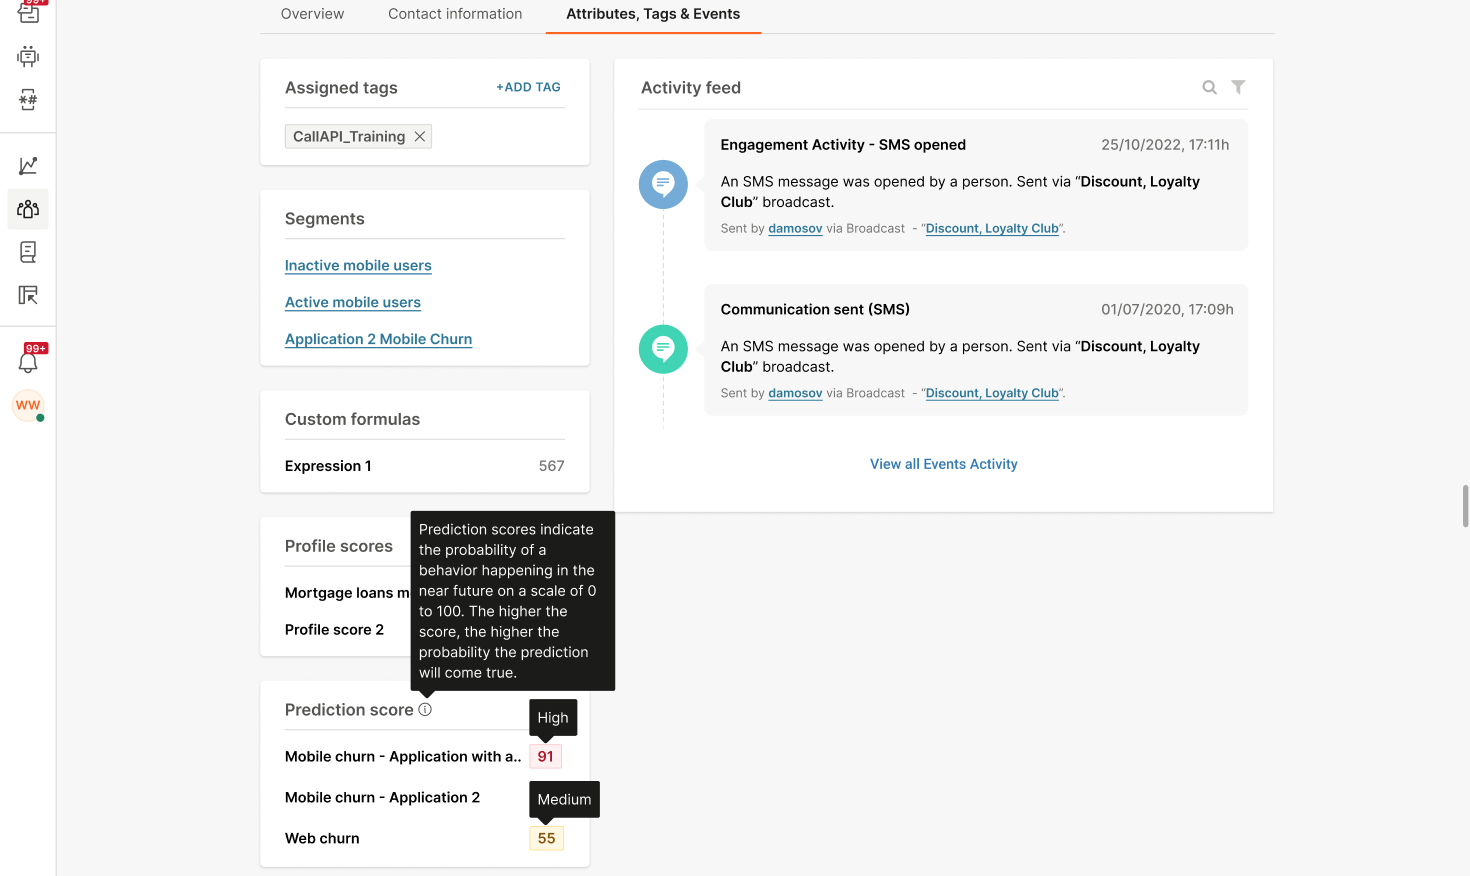
Prediction scores indicate the probability of a behavior happening in the near future (churn in 7 days). The score is on a scale of 1 to 100. The higher the score, the higher the probability that the prediction will come true.
| Prediction Score | Value | Description |
|---|---|---|
| High | 90-100 | The user is at a high risk of churn very soon. |
| Medium | 40-90 | The user may churn soon. |
| Low | 0-40 | User is unlikely to churn soon. |
Configure Mobile Churn Prediction
After you have completed the Getting Started steps, you are ready to configure mobile churn prediction for your mobile applications:
-
Open the People module and navigate to People > AI Predictions
-
On the Mobile churn prediction tile, click Open
-
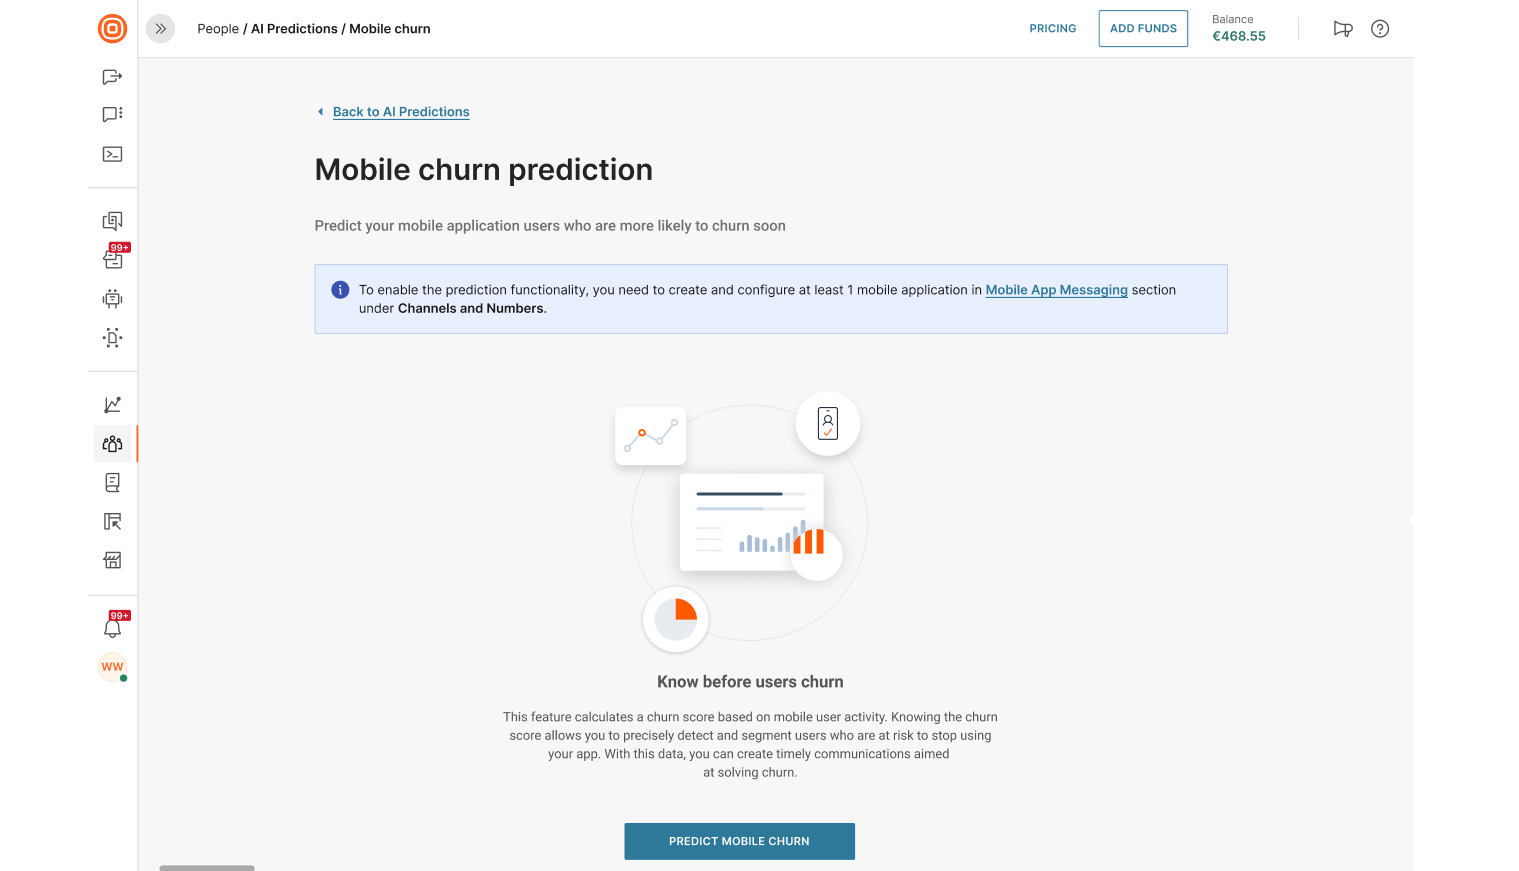
Click Predict Mobile Churn
NOTEIf you have not already created and configured at least 1 mobile application by this point then head over to Mobile push and In-app messages documentation to get started.
-
Select the mobile application that you would like to analyze and create a prediction model for.
-
Click Continue to start the data processing stage. It can take up to 48 hours to process the data for all user profiles in your instance so check back regularly to see if the prediction model has been created.
Once data processing is complete, you will be able to view the statistics for your mobile applications in the mobile churn prediction dashboard. Accessible by repeating steps 1 to 3 in the above instructions.
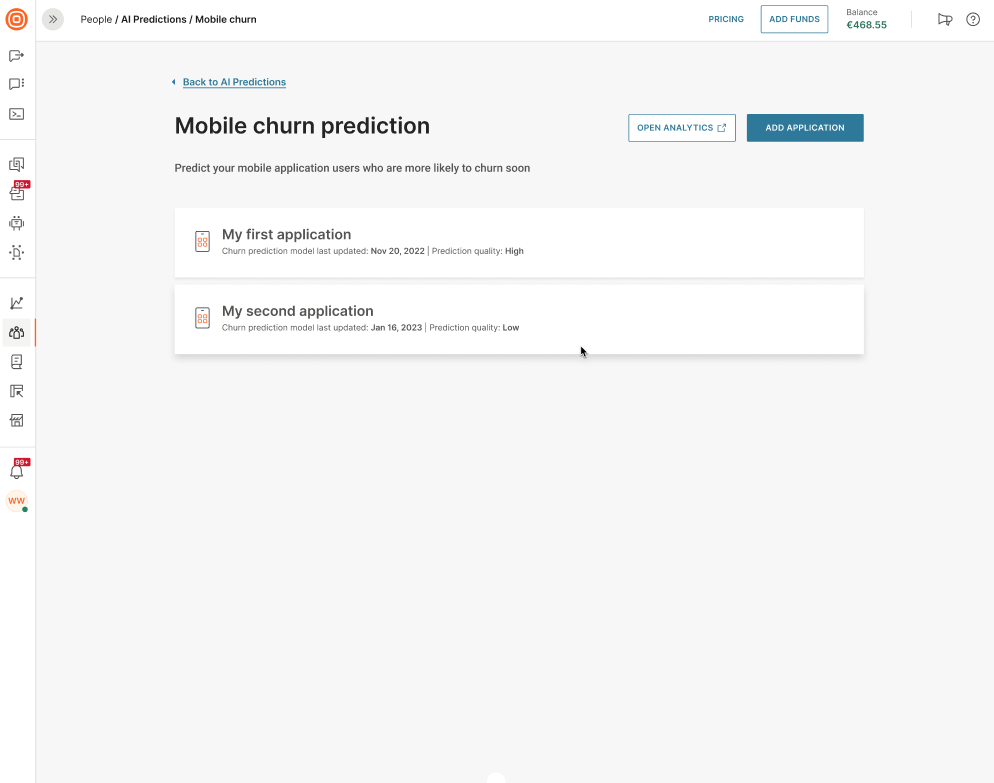
You can add a maximum of 4 mobile applications for churn prediction at any one time.
View Churn Prediction
You can view mobile churn prediction for each of your mobile applications that have an active prediction model and individually at person profile level.
View by Mobile Application
To view churn prediction metrics for a mobile application, navigate to the People module, select AI Predictions, and choose the Mobile Churn Prediction tile. Then select which application you would like to view metrics for.
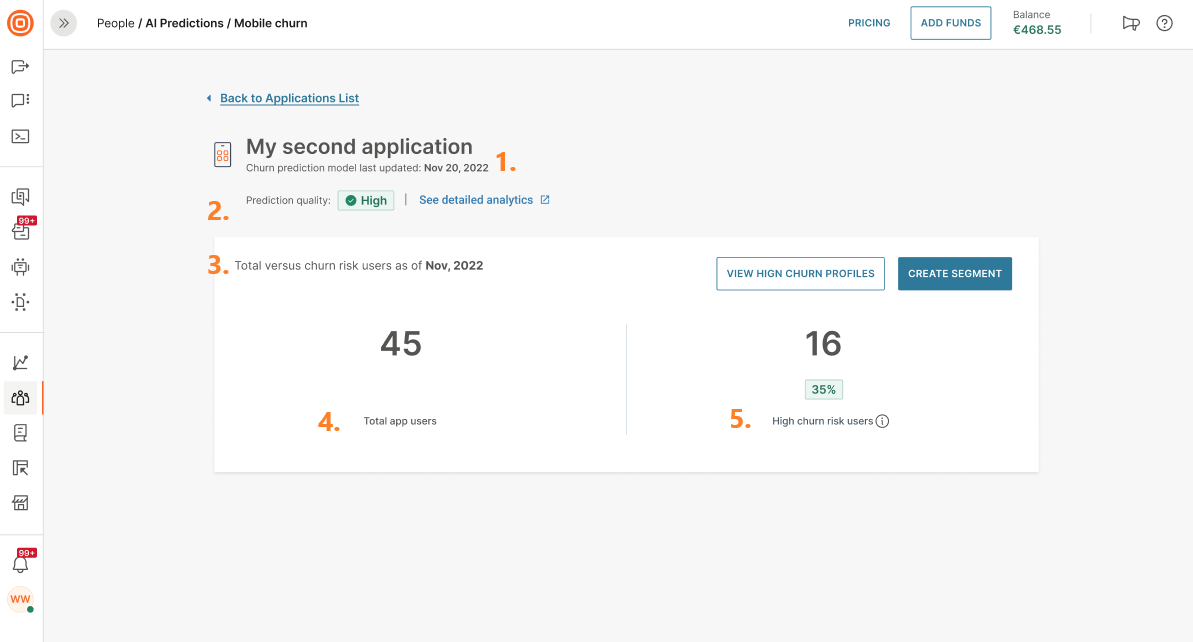
The application will open to display the following metrics:
-
Churn prediction model last updated: Date when churn prediction model was last updated for this application. The model updates every night in alignment with your time zone settings.
-
Prediction Quality: A visual indicator of the prediction data quality.
Prediction Quality Description High Prediction can be trusted due to the large amount of behavior data used in the calculation. Medium The prediction may not be precise due to lack of user behavior data. Low The prediction needs more data to ensure prediction reliability. Prediction quality will improve as new data is collected by the prediction model. -
Total versus churn risk users as of date: Date of last update of the prediction model
-
Total app users: Number of users that use the app.
-
High churn risk users: Number of users that have been identified as high churn risk. Also visualized as a % of total app users.
You can then use this data, click View High Churn Profiles to see all profiles that have a high probability of churn for your mobile application.
Alternatively, click Create Segment to create a segment of the high-risk users that you can then use to target for re-engagement campaigns in Flow or Broadcast.
View by Person Profile
View live mobile churn prediction scores for all your mobile applications from directly within a person profile. Simply select the Attributes, Tags and Events tab of a person profile and scroll to the Prediction score tile.
The prediction score tile contains the churn prediction scores for all mobile applications that the user has interacted with. The higher the number, the more likely the person will churn.
Use Churn Prediction
Once the system has identified profiles that are a high risk of churn for your mobile application, you will naturally want to engage with these users to stop them from churning.
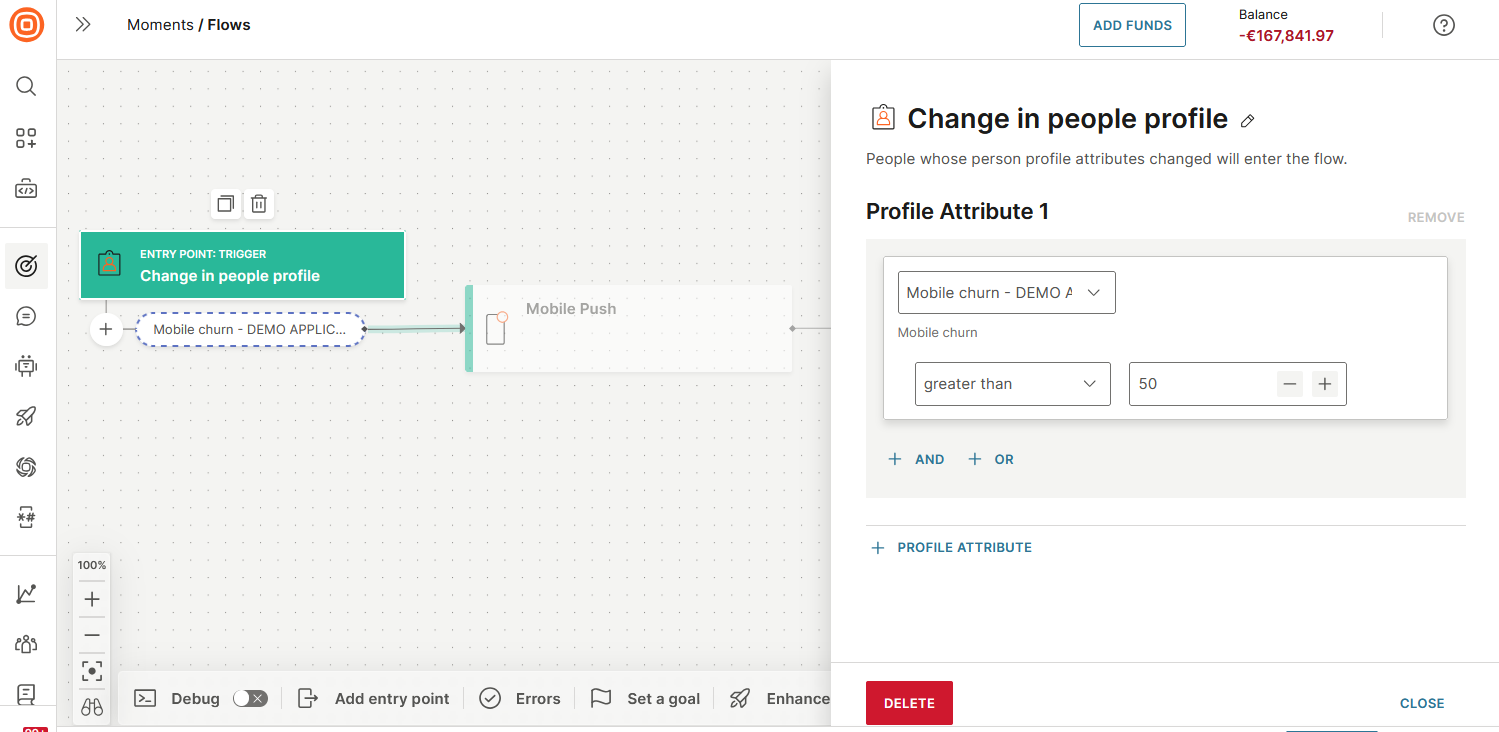
You can do this by using the Change in Person Profile entry point and the mobile churn score which is available as a person profile attribute.
This entry point is handy to use because a Flow can be triggered as soon as a person exceeds a particular mobile churn score.
You can then design your Flow to re-engage with the person, such as, to send them a Push Notification with a discount message.
Analyze Churn Prediction
To dive deeper into mobile churn prediction analytics for your mobile applications then head over to People Analytics where you will find mobile churn prediction dashboards with graphs to help you track churn probability over a period of time.