New channels dashboard
EARLY ACCESSThe Analyze dashboard is an intuitive web interface designed to help you understand and evaluate your communication channels. With a consistent design tailored to each channel, you can explore key metrics and trends to assess the effectiveness of your messages. Whether you are sending messages through the portal or through the API, the dashboard offers a seamless experience, allowing you to focus on the performance of each channel individually.
With the release of the redesigned Analyze dashboard with enhanced features, we are also introducing a dual dashboard system during the transition period. This means you may have access to both the old and new dashboards simultaneously, depending on the channels you use.
SMS, MMS, WhatsApp, Email, RCS, Viber BM, Voice and Video, Apple Messages for Business, Messenger, Telegram, Instagram DM, Kakao, LINE, and Zalo channel information will now be available only on the new dashboard. If you use these channels, you will no longer see them on the old dashboard.
New dashboard design
The new dashboard enhances the way you access and interpret your communication data by introducing new metrics and improving filtering capabilities. This early access release provides a set of customized dashboards offering valuable insights.
The new design offers enhanced metrics for deeper insights into message delivery and recipient interactions. These metrics include detailed message delivery statuses and engagement data such as clicks, unique clicks, CTR, CTOR, seens, and opens. Providing comprehensive delivery and interaction data, these metrics help you understand customer engagements and trends more effectively.
The new Analyze dashboard is available for the following channels:
- SMS
- MMS
- RCS
- Viber Business Messages
- Voice and Video
- Apple Messages for Business
- Messenger
- Telegram
- Instagram DM
- Kakao
- LINE
- Zalo
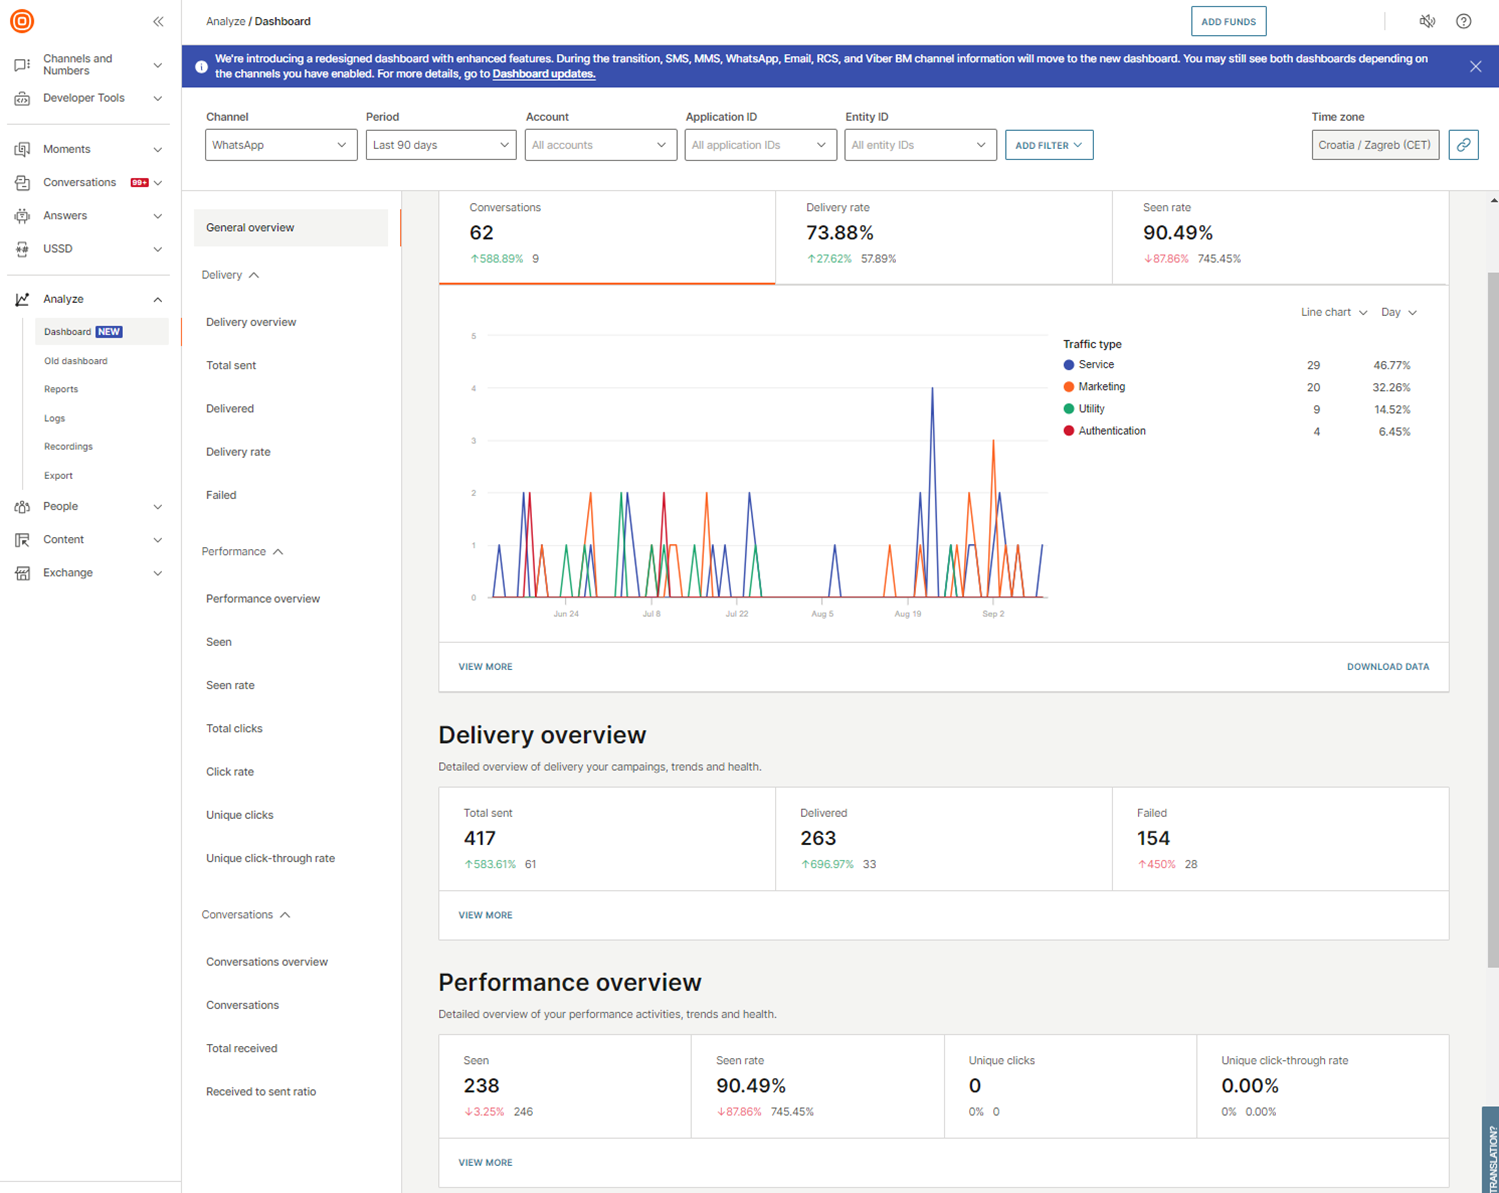
The new dashboard lets you filter your traffic by channel, period, account, application ID, entity ID, country, network, final status, or error code. You can also copy and share a link to view updated data with the applied filters. Remember that some filters are only available for specific channels (for example, filters sender type and network are available only for SMS and MMS dashboards).
The new dashboard will not be available for legacy account setups.
Explore these enhanced capabilities and deep dive into your traffic metrics.


Get started
To use the new Analyze dashboard, follow these steps:
-
Navigate to the dashboard (opens in a new tab).
- Access the new Analyze dashboard with your Infobip account: On the left side menu, select Analyze > Dashboard.
-
Set up your dashboard.
- Customize the dashboard by selecting the relevant metrics and filters that suit your needs.
-
Apply filters.
- Use the advanced filtering options to tailor the data to your specific requirements.
-
Track and analyze.
- Keep track of your message delivery, understand customer engagement, and generate customized reports.
Dashboard configuration
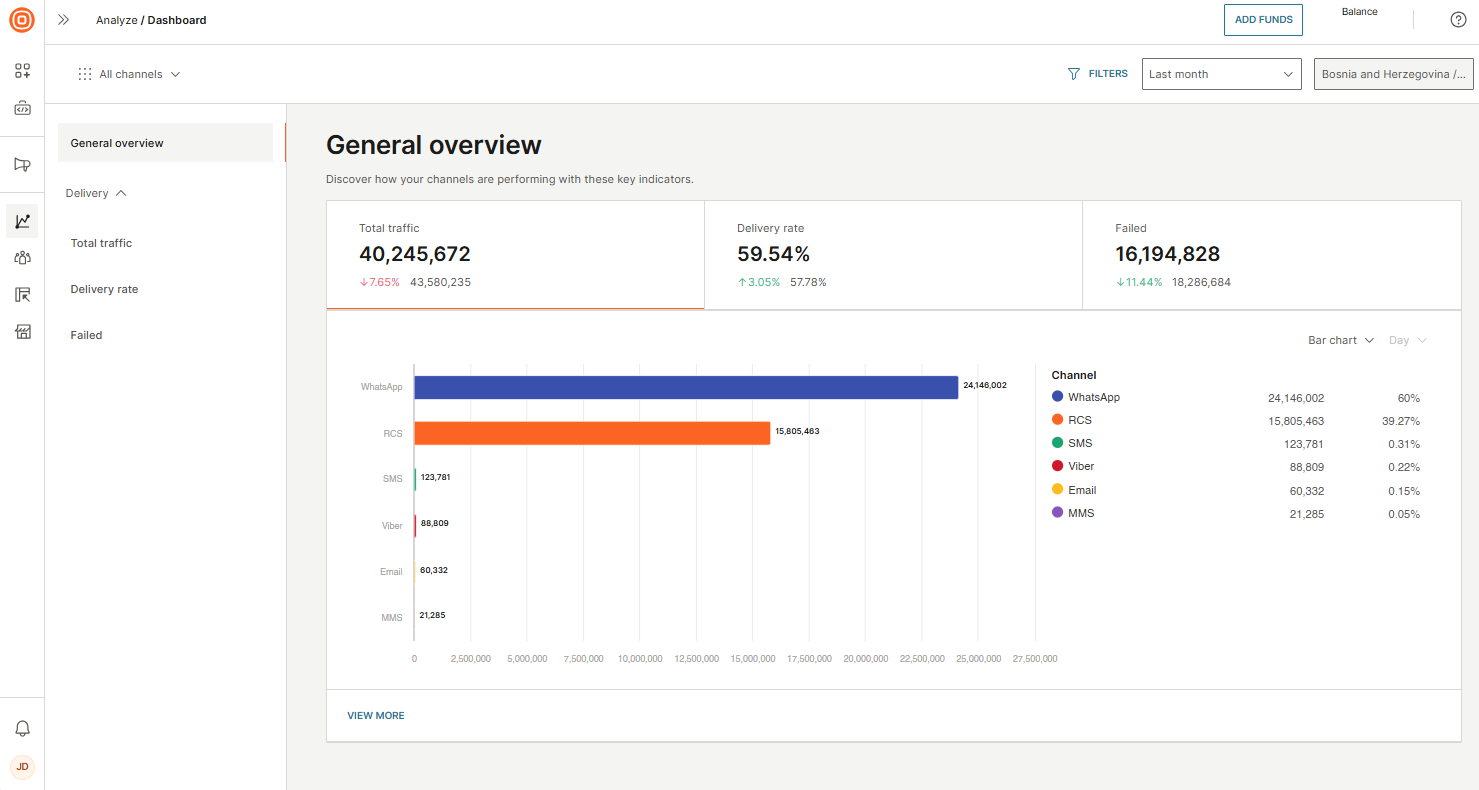
The new Analyze dashboard provides a comprehensive view of all your communication channels' performance, highlighting three key indicators: total traffic, delivery rate, and failed messages. Each indicator is accompanied by supporting data, offering additional insights and general trends on traffic performance. The data is presented in a graphical format for straightforward interpretation.
- Total traffic: This metric represents the total number of messages sent to and received from customers, encompassing outbound and inbound communications.
- Delivery rate: This indicator shows the percentage of messages successfully delivered to recipients.
- Failed messages: This metric reflects the total number of sent (outbound) messages that were not delivered to recipients.
The dashboard allows you to filter data by various criteria, including period, account, entity ID (if you are a CPaaS X customer), and custom filters such as status group, status, or error code.
To access the individual channel dashboard, under the Channel option, choose your preferred channel. The dashboard provides a comprehensive view, divided into several main sections, which can differ slightly depending on the chosen channel: General overview, Delivery, Performance, Inbound Messaging, Conversations and Interactions. Each section offers detailed metrics to help you understand your channel's performance.
General overview
The General overview page gives you a snapshot of how your channel is performing with the following key indicators, all presented in graphical format:
- Total traffic - The overall number of messages or message segments sent and received.
- Available for SMS, MMS, RCS, Viber BM, Apple Messages for Business, Messenger, Telegram, Instagram DM, Kakao, LINE, Zalo.
- Total messages - The total number of SMS messages sent to and received from customers.
- Available for SMS.
- Delivery rate - The percentage of successfully delivered messages.
- Conversations - The total number of message threads between your business and customers across all conversation categories.
- Available for WhatsApp.
- Conversations and messages - The total number of messages and message threads sent between your business and customers across all categories.
- Available for RCS.
- Seen rate - The percentage of messages seen by unique recipients. Note that recipients can turn off their read receipts, which may result in a lower seen rate.
- Available for WhatsApp, RCS, and Viber BM.
You also get a snapshot of each indicator. These sections provide insight into message delivery and content performance, as well as an overview of inbound and outbound messages and seen rate (where available).
Delivery
The Delivery page provides a detailed overview of your message delivery, including insights into failed messages. This section helps you understand the performance of your message delivery and identify areas for improvement.
Key indicators
- Total sent: The total number of messages sent.
- Delivered: The number of messages successfully delivered to recipients.
- Failed: The number of messages that failed to reach recipients.
Detailed indicators
- Delivery rate: The percentage of successfully delivered messages.
- Failed: The number of messages that failed to reach recipients.
- Error codes: A breakdown of error codes for total sent messages.
- Available only for SMS and MMS.
Performance
The Performance page provides a detailed overview of your performance activities, trends, and health.
Click count data is available only for messages with shortened URLs and tracking enabled. Seen count data, relevant for digital channels, may be affected by recipients turning off their read receipts.
Key indicators
- Unique clicks: The number of unique recipients who clicked on any link within a message (each recipient is counted only once).
- Unique click-through rate: The percentage of unique recipients who clicked on a link compared to the total number of messages delivered (each recipient is counted only once).
- Seen: The total number of messages that recipients across all channels have viewed.
- Available for WhatsApp, RCS, and Viber BM.
- Seen rate: The percentage of successfully delivered messages that recipients have viewed.
- Available for WhatsApp, RCS, and Viber BM.
Detailed indicators
- Total traffic: The overall number of messages sent and received.
- Available for SMS and MMS.
- Total clicks: The number of clicks on links within messages.
- Available for SMS, MMS, RCS, Viber BM, Apple Messages for Business, Messenger, Telegram, Instagram DM, Kakao, LINE, Zalo.
- Click rate: The percentage of clicks relative to the number of messages sent.
- Available for WhatsApp, RCS, Viber BM, Kakao, LINE, and Zalo.
Inbound messaging/Conversations/Interactions
This page provides an overview of the messages you received from your customers and a comparison of received and sent messages
Key indicators
- Total received: The total number of messages received from customers (inbound).
- Received to sent ratio: A comparison of the number of messages received to the number of messages sent.
- Conversations: A detailed overview of your WhatsApp conversations across all conversation categories.
- Available for WhatsApp.
- Conversations and messages: An overview of your RCS messages and conversations (message threads between your business and customers) across all categories.
- Available for RCS.
Supporting data
The Supporting data section provides additional breakdowns and insights into your metrics to help you gain deeper insights into specific aspects of your message performance.
Depending on the selected channel and key metric, you can see further data based on:
- Communication: A breakdown of metrics based on the type of communication, allowing you to analyze performance across different channels.
- Country: A detailed view of your metrics by geographic region, providing insights into how your messages are performing across various countries.
- Network: A breakdown of metrics by network provider, helping you identify performance trends or issues related to specific networks.
- Sender: Insights based on the sender information, enabling you to assess performance across different senders or sender domains.
- Application: Get insights into how your message performs across different applications. Track delivery, engagements, and errors to better optimize your campaigns.
- Entity: See the performance of your messages associated with specific entities. Analyze delivery rates, engagement, and errors and get granular insights for better decision-making.
For SMS and MMS, there are more supported data available:
- Time to deliver: Insights into the time taken for messages to be delivered.
- Delivered within 5 seconds by country: A detailed view of messages delivered within 5 seconds, categorized by country.
- Delivered by country: A breakdown of delivered messages by country.
For more detailed information on the types of available metrics, refer to the Metrics API documentation. However, as the Analyze dashboard is still evolving, it might not contain every enriched metric available on the dashboard.